Dashboard Solutions
Transform Your Data into Actionable Insights
Interactive Dashboards for Data-Driven Decisions
Transform complex data into clear, actionable insights with Headland Afrika's custom dashboard solutions. Our interactive visualizations empower organizations to monitor performance, track KPIs, and make informed decisions in real-time.
Real-time Analytics
Live data updates and instant performance insights
Custom Visualizations
Tailored charts and graphs for your specific needs
Mobile Responsive
Access your data anytime, anywhere on any device
Secure & Scalable
Enterprise-grade security with unlimited scalability
Types of Dashboards We Build
Custom dashboard solutions tailored to your specific business needs and objectives
Executive Dashboards
High-level overview dashboards for senior leadership with key performance indicators and strategic metrics.
- Executive-level KPIs
- Strategic goal tracking
- Drill-down capabilities
- Real-time alerts
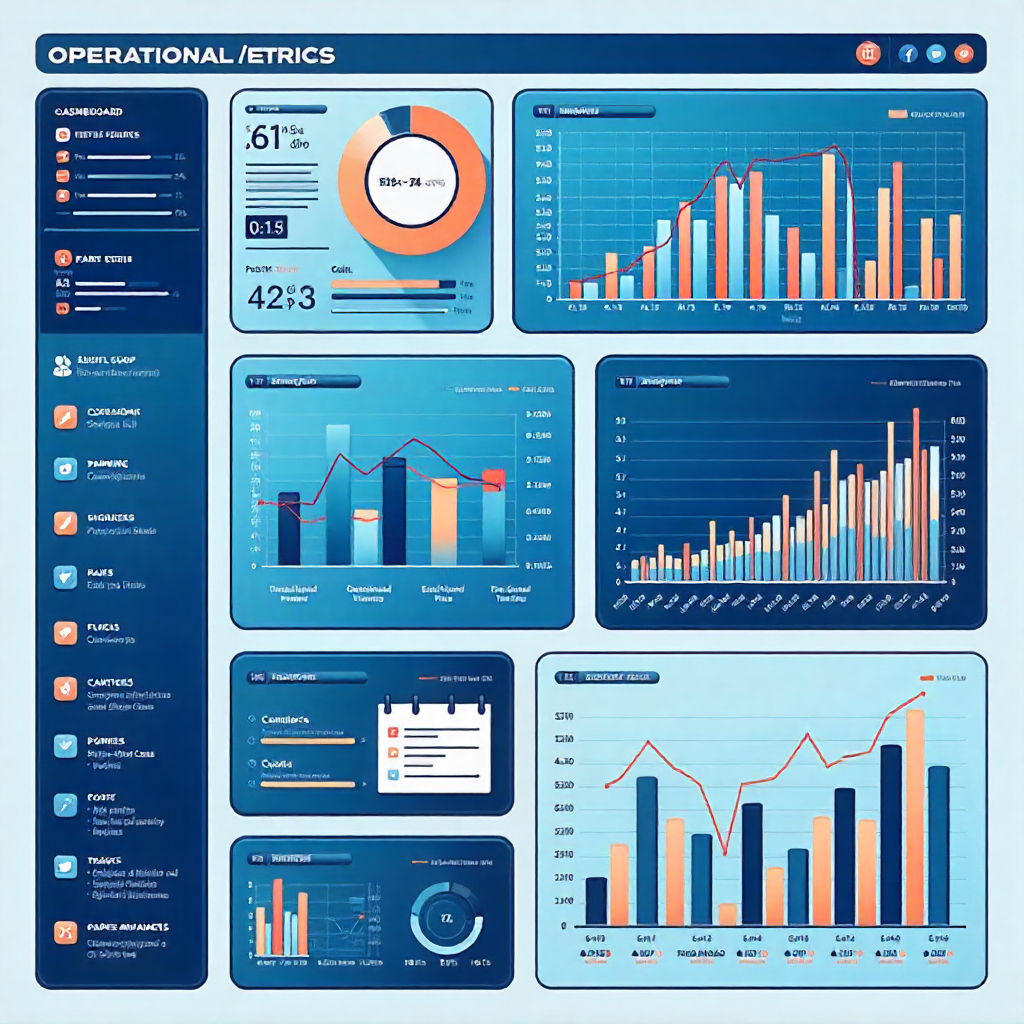
Operational Dashboards
Real-time operational metrics for day-to-day management and performance monitoring.
- Real-time data feeds
- Operational metrics
- Performance tracking
- Team productivity
Analytical Dashboards
Advanced analytics and data exploration tools for deep insights and trend analysis.
- Advanced analytics
- Trend analysis
- Predictive insights
- Data exploration
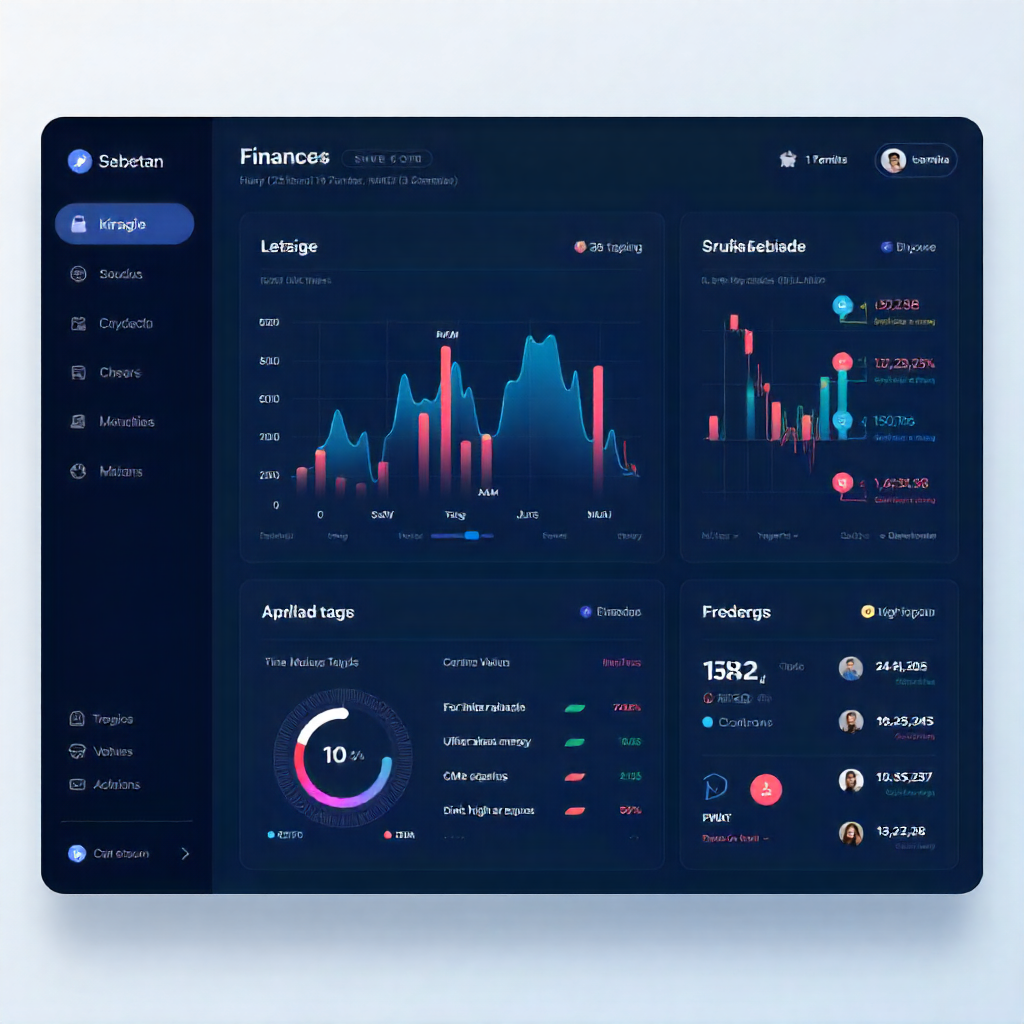
Departmental Dashboards
Specialized dashboards for specific departments like sales, marketing, HR, and finance.
- Department-specific metrics
- Cross-functional data
- Collaboration tools
- Custom reporting
Geospatial Dashboards
Location-based analytics and mapping visualizations for regional performance analysis.
- Interactive maps
- Regional comparisons
- Location analytics
- Territory management
Mobile Dashboards
Optimized dashboards for mobile devices with touch-friendly interfaces and offline capabilities.
- Mobile-optimized
- Touch interface
- Offline access
- Push notifications
Advanced Dashboard Features
Powerful capabilities that make our dashboard solutions stand out
Real-time Updates
Live data streaming and automatic updates without page refresh
Interactive Filtering
Dynamic filtering and slicing of data across multiple dimensions
Export Capabilities
Export data and visualizations in multiple formats (PDF, Excel, PNG)
Smart Alerts
Automated alerts and notifications for critical metrics and thresholds
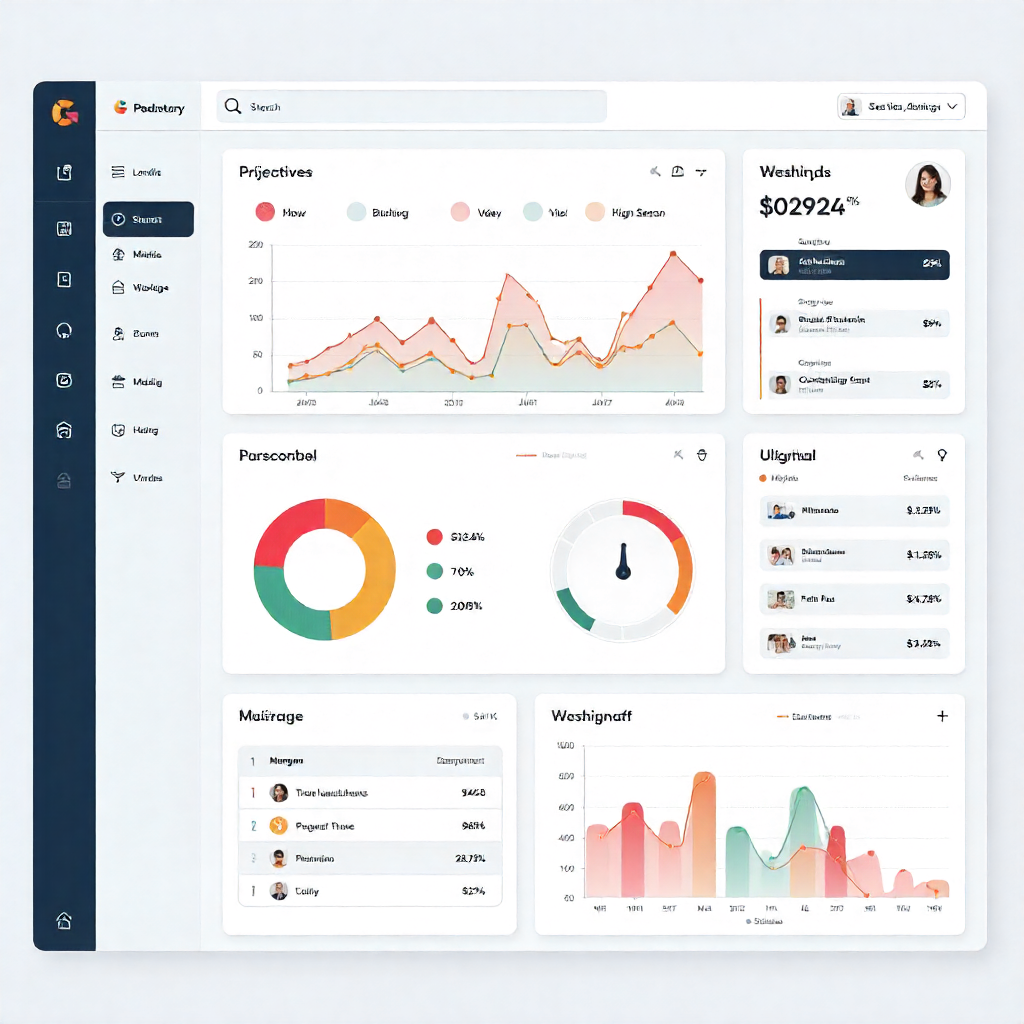
Dashboard Visualizations
See how we transform raw data into compelling visual stories

Benefits of Our Dashboard Solutions
How our dashboard solutions drive value and transformation for your organization
Enhanced Visibility
Gain complete visibility into your operations with consolidated data from multiple sources in one unified view.
Faster Decisions
Reduce decision-making time with real-time data and intuitive visualizations that highlight key insights instantly.
Improved Performance
Identify performance gaps and opportunities for improvement through continuous monitoring and trend analysis.
Cost Efficiency
Automate reporting processes and reduce manual data compilation, saving time and resources across your organization.
Data Security
Ensure data integrity and security with role-based access controls and enterprise-grade security protocols.
Scalability
Grow with your business needs - our dashboards scale seamlessly as your data volume and user base expands.
Our Dashboard Development Process
We follow a structured methodology to ensure your dashboard solution delivers maximum value from day one. Our process begins with comprehensive requirements gathering and stakeholder workshops to understand your unique business needs and objectives.
Our team of data visualization experts then designs wireframes and prototypes, ensuring the dashboard is both functional and user-friendly. We use agile development methodologies to build, test, and refine the solution in iterative cycles, incorporating your feedback throughout the process.
Key Success Metrics
75% Faster Reporting
Automated dashboard reporting reduces manual compilation time from days to minutes, enabling faster access to critical business insights.
90% User Adoption
Intuitive design and user-friendly interfaces ensure high adoption rates across all levels of your organization.
40% Better Insights
Advanced visualization techniques and interactive features help users uncover insights that were previously hidden in raw data.
Technical Specifications
Ready to Transform Your Data into Insights?
Let's build a custom dashboard solution that drives your organization forward with data-driven decision making.